Beyond Course Completion: L&D Metrics That Prove Business Impact

Only 8% of organizations currently measure the business impact of their learning programs. Course completion rate has been the default scoreboard for corporate learning for years. It's easy to track, easy to report, and easy to put on a slide for leadership. It does not answer what leadership actually wants to know: did this training change how employees perform.
The completion trap: The actual challenge
Enterprises have poured significant budget into learning content libraries, and average course completion rates hover below 20%. Learners face too much choice with too little guidance on what matters for their specific role, and disengage before finishing.
Even when content ships, the cycle runs slow. Traditional course development takes three to six months, while business priorities shift every quarter. By the time a course ships, the business need it was built for has often already moved on.
L&D teams end up reporting a number, completion rate, disconnected from both how the content was built and what it was supposed to achieve. Ninety-five percent completion tells leadership nothing about whether performance actually improved.
Completion isn't capability
Finishing a course is not the same as doing the job better because of it. A learner can click through every module and pass every quiz without retaining anything usable on the floor, on a sales call, or at a workstation.
Three shifts define how leading organizations now approach this.
- From course completion to capability building: success is measured by skills acquired and applied on the job, not courses finished.
- From static content to adaptive learning: fixed curricula built once and left alone give way to systems that adjust based on learner progress, performance data, and changing business need.
- From lagging metrics to real-time insight: quarterly completion reports give way to dashboards showing engagement, skill development, and performance correlation as they happen, not months later.
The training-effectiveness field has a name for the first four levels of this shift: the Kirkpatrick model, extended with a fifth level for financial ROI.
- Level 1 measures reaction, post-training satisfaction.
- Level 2 measures learning, pre- and post-assessment scores.
- Level 3 measures behavior, on-the-job application.
- Level 4 measures results, the business KPIs actually affected.
- Level 5 measures ROI directly.
Most organizations stop at Levels 1 and 2, satisfaction and knowledge checks, and never reach the levels that connect to business outcomes.
What business leaders are actually asking for
Business leaders are no longer satisfied with learning metrics that exist in isolation from business performance. They expect L&D to demonstrate a clear connection between learning investment and strategic business outcomes, not proof that people logged in.
Four things come up consistently in what business leaders expect from L&D:
- Faster time-to-productivity. Reducing how long it takes new hires or transitioning employees to reach full performance capability.
- Role-based, personalized learning. Tailored to actual role, skill gaps, and career stage, not generic curricula.
- Measurable performance impact. Learning activity connected directly to productivity, quality, and retention.
- Scalable global rollout. Consistent quality and relevance across distributed, multi-region workforces.
None of these are answered by a completion percentage. They are answered by data that ties learning activity to what happens on the job afterward.
The metrics that actually connect to ROI
Four categories replace completion rate as the metric that matters:
-
Time-to-proficiency. How long it takes someone to reach full performance capability, not how long it takes them to finish a course. Effective programs can reduce this by up to 30% compared to traditional approaches.
-
Skill adoption rate. Whether people are actually applying what they learned in day-to-day work, not whether they passed an end-of-module quiz.
-
Engagement-performance correlation. Whether learning engagement statistically tracks with individual performance ratings. A strong correlation is what validates that a program is working; a weak one signals a program built for completion, not capability.
-
Business KPI linkage. Productivity gains, quality improvements, and retention, tied directly back to specific learning activity rather than reported as a separate, disconnected metric.
Organizations that measure learning outcomes this way see the payoff directly: companies that measure ROI effectively achieve $4 to $5 in return for every $1 invested, and ROI varies meaningfully by training type, 100% to 350% for sales training, 100% to 200% for onboarding, and 150% to 300% for technical skills training.
Our solution, MimirAI achieved 4.5+ app rating, roughly 60 NPS, 1 million monthly active users, and a 50% cost reduction. The metrics that matter connect learning to performance and cost, not to click-throughs.
The takeaway
Course completion rate answers a narrow question: did employees get through the material? It does not answer whether they can now do their job better, faster, or with fewer errors, the actual reason L&D budgets exist. Organizations that want to prove ROI need to track capability and performance signals instead, and build the underlying content and platform to generate that data in real time rather than in a quarterly report.
L&D ROI Metrics: Frequently Asked Questions
1. How do you measure the business impact of an L&D program?
Use a framework that goes beyond satisfaction and knowledge checks. The Kirkpatrick model's five levels move from reaction (satisfaction) and learning (assessment scores) through behavior (on-the-job application), results (business KPIs affected), and ROI (financial return). Business impact only becomes visible at Levels 3 through 5, where learning activity is tied to what people actually do differently at work and what that change is worth. Most organizations measure only Levels 1 and 2 and never reach the levels that show impact.
2. What should L&D teams measure instead of course completion rate?
Four categories: time-to-proficiency, how long it takes someone to reach full performance capability; skill adoption rate, whether learned skills show up in day-to-day work rather than just an end-of-module quiz; engagement-performance correlation, whether learning engagement statistically tracks with performance ratings; and business KPI linkage, connecting learning activity directly to productivity, quality, and retention metrics rather than reporting it as a separate number.
3. Why does course completion rate not prove training effectiveness?
Completion confirms a module was opened and finished. It says nothing about whether the material was retained, whether it transferred to actual work, or whether performance changed as a result. A learner can click through every module and pass every quiz without being able to apply any of it on the floor, on a sales call, or at a workstation, which is exactly the gap completion rate cannot detect.
4. How do you calculate the ROI of employee training?
Kirkpatrick's fifth level frames it directly: ROI equals the financial benefit of the training minus its cost, divided by the cost. In practice, that requires isolating a specific business outcome, productivity gain, quality improvement, retention increase, and attributing a defined share of it to the training itself. Actual returns vary meaningfully by training type: sales training typically delivers 100% to 350% ROI, onboarding programs 100% to 200%, and technical skills training 150% to 300%, and organizations that measure this rigorously report $4 to $5 in return for every $1 invested.
5. How do you link employee training to business KPIs?
Track the specific KPI a training program is meant to move, productivity, quality, or retention, before the program launches, then measure the same KPI against learners' post-training performance and skill adoption data. That connection is what business KPI linkage means in practice: not a general claim that training helps, but a specific, trackable line between a training intervention and a defined business metric, measured continuously rather than assumed after the fact.
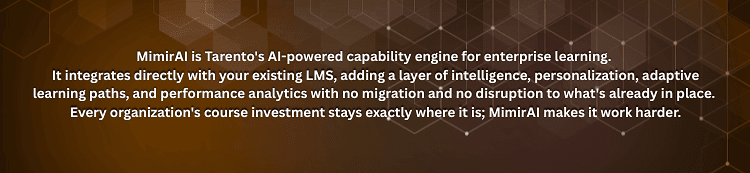
MimirAI is built around the metrics that actually matter: a Competency Passbook that tracks proficiency and skill adoption per employee, continuous micro-assessments instead of quarterly reviews, and dashboards that connect learning activity directly to performance data. See what tracking capability instead of completion looks like for your organization. Explore MimirAI.


PowerCenter End of Support: 4 Migration Paths for Enterprise Data Teams