Using Affinity Diagramming in Collaborative Analysis and Enterprise Design Workshops
Enterprise workshops rarely fail because teams lack information. They fail because the information never gets organised into something the team can act on.
After user research, stakeholder interviews, or ideation sessions, teams often have pages of notes, observations, and early ideas. Without a structured way to sort them, patterns stay buried, decisions rely on instinct, and delivery teams leave without confidence on what to do next.
Affinity diagramming closes that gap. Used well in our enterprise and LEAD Sprint workshop settings, it turns scattered research findings, stakeholder inputs, and ideation notes into shared themes, priorities, and next steps the team can act on immediately.
Why Enterprise Workshop Findings Rarely Become Decisions
The issue is rarely the quality of research. It is the lack of structure after the research is done.
In enterprise settings, workshop outputs often become difficult to reuse. Research notes sit in documents no one revisits. Sticky notes remain as photos. Stakeholder insights are summarised into slides that not everyone agrees with.
The larger the group, the harder this becomes. Different roles notice different things. A product manager, a UX designer, a developer, and a business stakeholder may all observe the same session but draw different conclusions. Without a shared method for reviewing and organising findings, interpretation becomes fragmented, decision-making slows, and design direction becomes unclear.
Collaborative sorting solves this by helping teams review what was collected, identify patterns together, and agree on priorities before design decisions are made.
What Is Affinity Diagramming in Enterprise Workshops?
What the Method Actually Does
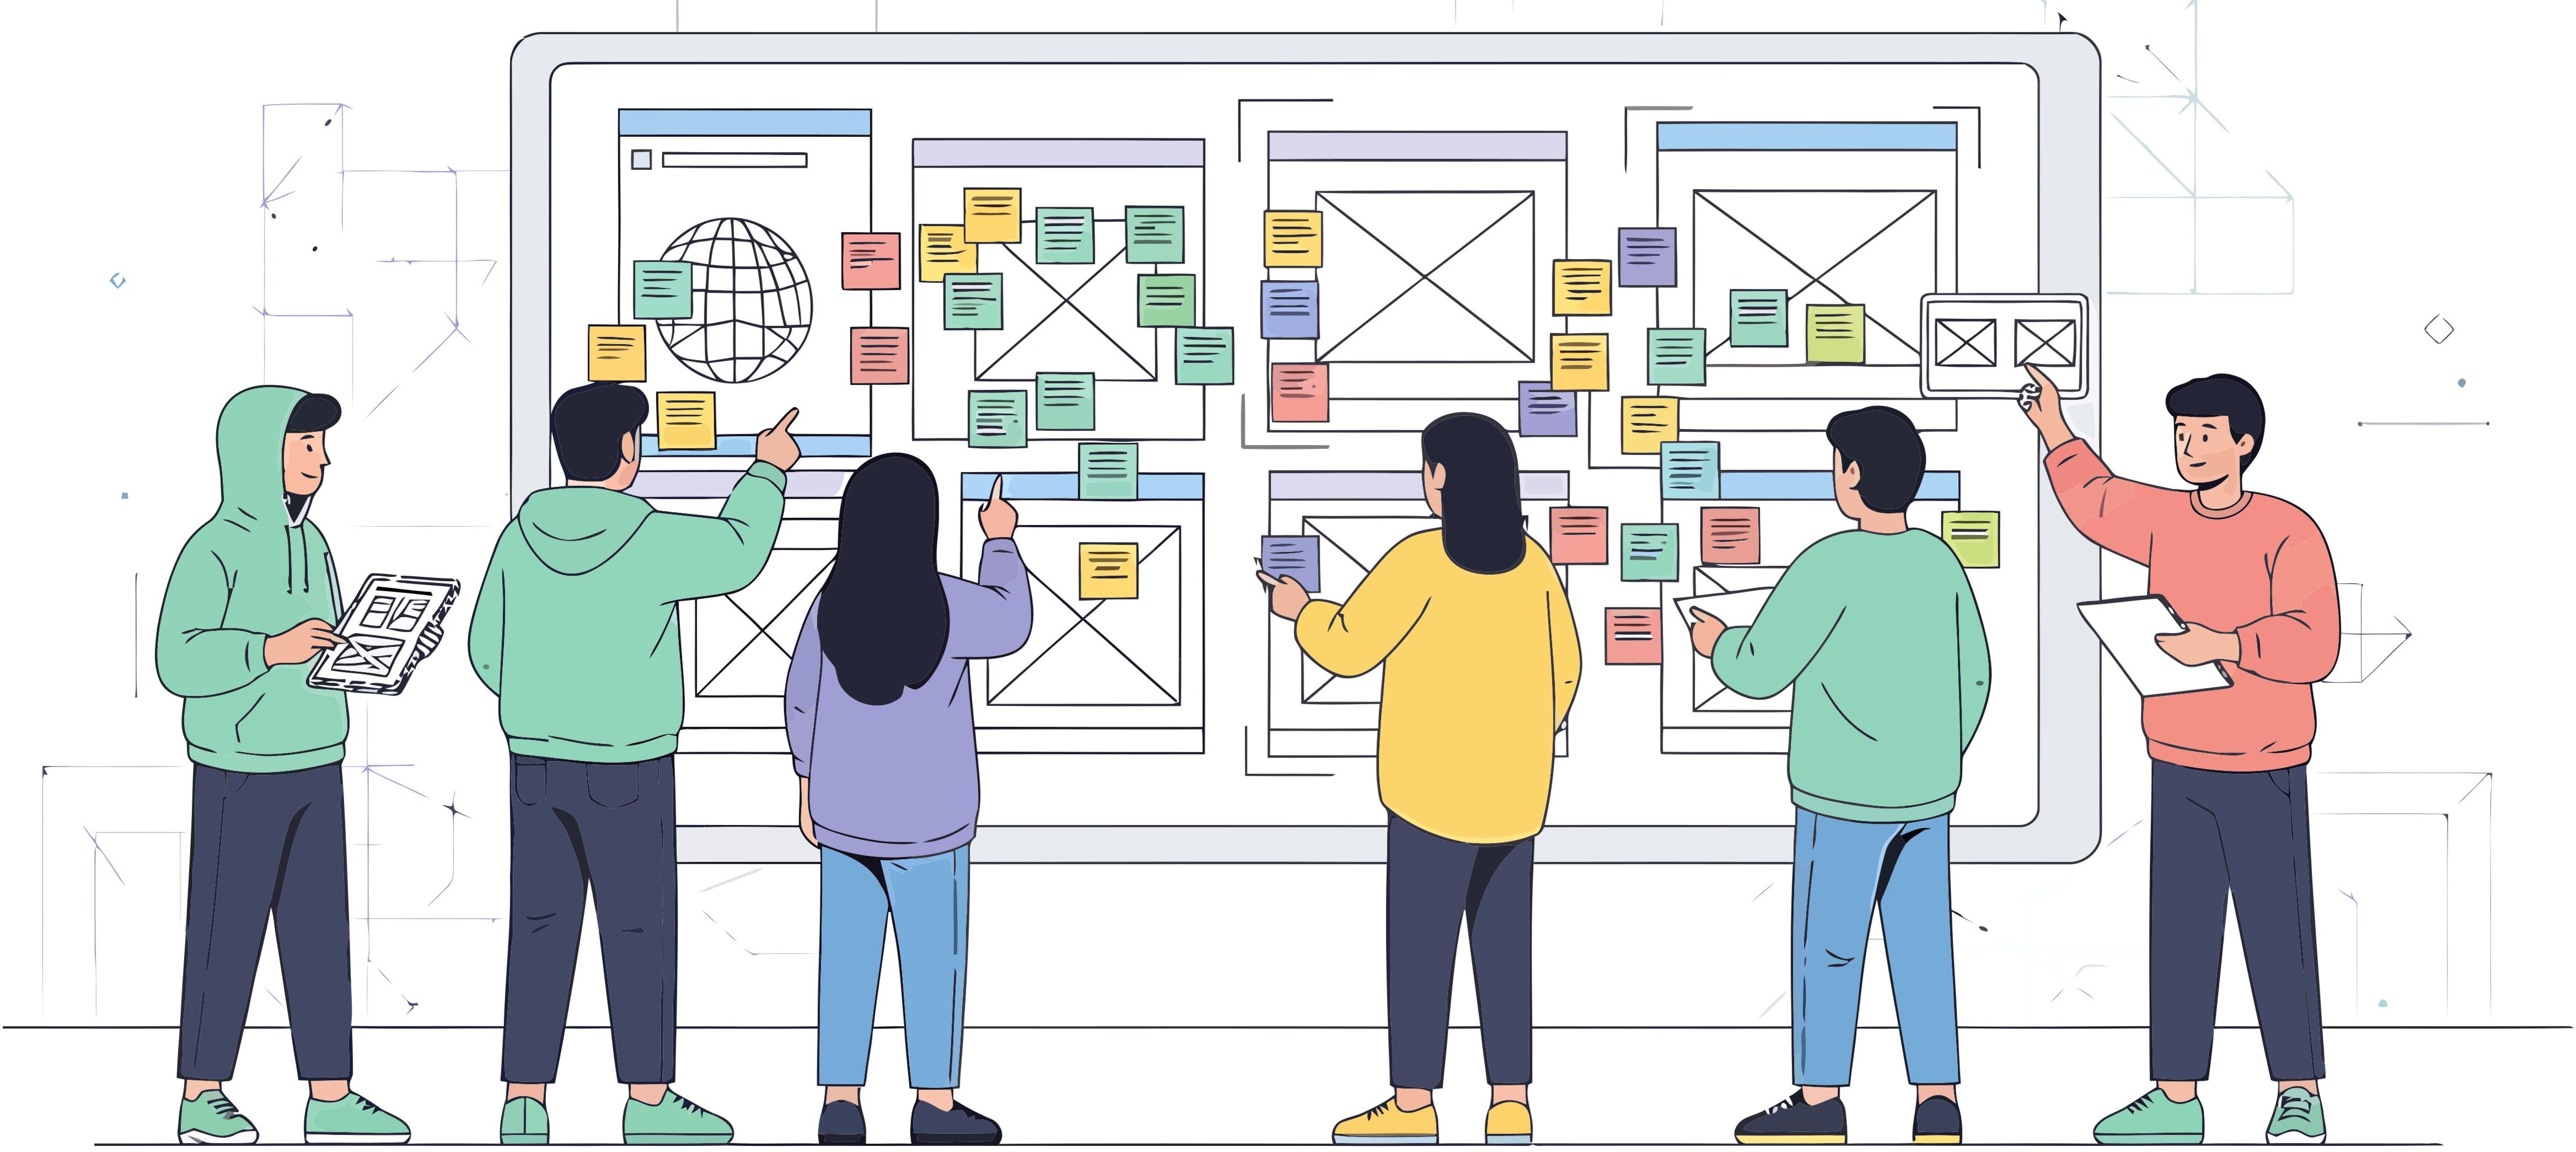
Affinity diagramming is a structured group activity where teams organise individual observations, ideas, or data points into clusters with a common theme. Each item is written as a separate note, then moved, grouped, and labelled collaboratively.
The output is a visual map of what the team collectively understands about a problem, user group, or design challenge. That map becomes the basis for prioritisation and delivery decisions.
In enterprise delivery, affinity diagramming helps with:
- Synthesising user research or stakeholder interview findings
- Organising design ideation outputs into feature directions
- Building shared understanding across UX, product, business, and engineering teams
- Aligning teams on problem areas before committing to a solution
Why It Works Particularly Well in LEAD Workshop Settings
Enterprise workshops bring together people with different priorities and mental models. Each person sees the same problem from a different angle.
Affinity diagramming works because it externalises thinking. Instead of asking people to agree on a conclusion too early, it asks them to contribute observations first and find connections together. Alignment happens through participation, not persuasion.
In Tarento’s LEAD workshops, this supports genuine co-creation. When enterprise clients and delivery teams sort findings together, the output reflects shared understanding rather than a consultant’s interpretation handed back to the client.
The act of moving items, questioning groupings, and naming themes is where the value sits. The diagram records the discussion; the discussion creates the alignment.
How to Run an Affinity Diagramming Workshop Inside a Delivery Sprint
Step 1: Generate Individual Observations Without Influence
Start by getting ideas out of people’s heads and onto separate notes before the group discussion begins.
Each participant writes one observation, idea, or data point per note. These may include research quotes, usability patterns, feature ideas, or themes from stakeholder interviews.
This step should be independent. If people discuss too early, perspectives converge, dominant voices shape the room, and weaker signals get lost.
Practical guidance:
- Set a fixed time limit, usually five to ten minutes
- Write one clear item per note
- Avoid discussion until all notes are posted
- Use colours only when they clarify input types, such as user quotes versus team observations
Step 2: Cluster Notes Into Emerging Themes
Once notes are posted, the team groups items that share a common thread. The process should be collaborative and iterative. Notes can move, split, or combine as patterns become clearer.
Do not force the data into a predefined framework. The clusters should reflect what the team actually found. Small clusters should not be ignored; even two related notes may reveal a risk, unmet need, or minority perspective.
The facilitator keeps the group moving without directing the answer. If a note belongs in two places, duplicate it rather than forcing a false choice.
Labels should be added only after the grouping stabilises. A good label represents the cluster clearly without overgeneralising. If it does not fit all notes, the cluster may need to be split.
Step 3: Prioritise Clusters and Define Next Steps
A completed affinity diagram is organised information, not yet a decision. The final step turns it into action.
The team reviews each cluster against the project goals. Dot voting can help surface consensus: each participant votes on the clusters they believe need attention first.
For every priority cluster, define a concrete next step:
- Navigation issues may lead to a focused redesign sprint
- Unmet feature expectations may trigger scope refinement with the product owner
- Accessibility concerns may lead to an audit before release
Each action must have an owner. Without ownership, the workshop remains theoretical. The diagram shows what the team agreed on; the action items convert agreement into delivery.
Affinity Diagramming vs. Card Sorting, Dot Voting, and Journey Mapping
Teams working across research and design often use multiple collaborative methods. The key is knowing when each method fits.
| Method | Best Used For | Key Difference |
|---|---|---|
| Affinity diagramming | Organising mixed observations | Bottom-up themes emerge from data |
| Card sorting | Defining navigation and information architecture | Users group predefined content |
| Dot voting | Prioritising organised options | Decision tool, not synthesis |
| Journey mapping | Visualising end-to-end experience | Sequential, not thematic |
| How Might We | Reframing problems into opportunities | Follows synthesis; does not replace it |
Affinity diagramming is most valuable when the team does not yet know the main themes. It is a discovery and synthesis method. Once themes are clear, dot voting, journey mapping, or HMW statements can build on the findings.
In LEAD workshop programmes, it usually runs early — after research synthesis or an ideation round — so the team has a shared baseline before prioritisation and design direction.
A Lean Affinity Diagramming Framework for Delivery Teams
Affinity diagramming can fit into sprint-based delivery without needing long workshop blocks or a large research team.
| Workshop Stage | Activity | Goal | Typical Duration |
|---|---|---|---|
| Pre-workshop | Prepare data and notes | Keep inputs relevant | 1–2 hours |
| Opening | Independent note generation | Capture unbiased observations | 5–10 minutes |
| Core session | Cluster and label themes | Build shared understanding | 30–60 minutes |
| Closing | Dot voting and next steps | Prioritise and assign ownership | 20–30 minutes |
| Post-workshop | Document and share outputs | Preserve decisions for delivery | 1 hour |
The same structure works for research synthesis and design ideation. The inputs change, but the method stays consistent.
If you are earlier in the process, start with structured discovery to understand what research to bring into the workshop.
FAQ: Affinity Diagramming in Enterprise Workshops
1. Can affinity diagramming be used in remote or hybrid workshop settings?
Yes. Digital whiteboard tools work well if facilitation is clear. Keep the same order: independent note generation first, clustering second, prioritisation last. In remote sessions, ensure participants do not influence each other too early.
2. How many participants should an affinity diagramming session include?
Five to twelve participants is usually practical. Smaller groups may miss perspectives. Larger groups slow clustering and reduce participation. For large stakeholder groups, run smaller parallel sessions and merge outputs later.
3. How long does an affinity diagramming session take?
A focused session usually takes sixty to ninety minutes, including prioritisation. The quality depends on scoping the input. Trying to process too much data in one session leads to weaker clusters and slower decisions.
4. What is the difference between affinity diagramming and card sorting?
Affinity diagramming organises research findings or ideas generated by a team. Card sorting asks users to group predefined content, usually to inform navigation or information architecture. One is an internal synthesis method; the other is a user research method.
Explore how Tarento’s Experience Design practice and LEAD Sprints bring structured co-creation into enterprise delivery programmes.


How India's Second-Largest Commercial Vehicle Manufacturer Modernised Its SAP Integration Estate