Distributed Systems Performance and Scaling: How Engineering Leaders Make Better Architecture Decisions

A practical guide for CTOs, engineering leaders, and architects balancing performance, cost, reliability, and scale.
Distributed systems are not just bigger versions of small applications. At scale, the rules change. Memory is no longer cheap. Network round-trips are no longer negligible. A healthy average latency can still hide a p99 that hurts user experience and conversion. A load balancer that works in a steady state can fail badly during autoscaling or deploy churn.
Strong teams do not treat performance as something to “add later.” They treat it as a set of design trade-offs. Those trade-offs are measured, documented, and tied to business outcomes. They understand that time and memory are both budgets. They know caching is a design choice, not a shortcut. They know tail latency is where systems feel slow. And they know load balancing reflects real assumptions about state, traffic, and failure.
Distributed Systems Performance Summary: The 5 Core Scaling Trade-Offs
- Time complexity vs. space complexity is a production trade-off, not just a theory topic. Faster systems often consume more memory or infrastructure.
- Caching works when reuse is high, and invalidation is deliberate. It fails when TTLs ignore data volatility or overload the origin.
- Latency, throughput, and bandwidth are connected, but they are not the same. Tuning one in isolation often moves the bottleneck.
- Tail latency is not an edge case. At scale, slow outliers become an everyday user problem.
- Load balancing strategy reflects assumptions about state and topology. Round Robin suits stateless systems; Consistent Hashing preserves locality in stateful ones.
1. Time Complexity vs Space Complexity in Production Systems
Big-O is useful, but production systems force a more practical question: what happens to CPU, RAM, cache pressure, and latency when traffic grows 5×?
A precomputed index can speed up reads, but it may use significant memory. A streaming approach saves RAM, but may add CPU cost and processing time. A hash map gives near-constant lookups, but it also increases memory overhead and GC pressure. These are not academic details. They directly affect cost, latency, and reliability.
Another important concept is the working set: the data your service needs in fast memory to perform well. If it fits in CPU cache, the code is fast. If it spills into RAM, it slows. If it spills to disk, latency rises sharply.
Why This Matters for the Business
Bad space decisions show up as OOMKills, long GC pauses, and expensive autoscaling. Bad time decisions show up as queue buildup, SLO breaches, and overprovisioning.
At scale, constants matter. A small latency penalty at high RPS means more cores and more cost. A large per-pod cache multiplied across hundreds of pods becomes a major memory bill. During traffic spikes, the wrong trade-off often hurts both time and space simultaneously.
Key question: Is your optimization actually reducing cost and latency, or just shifting cost from CPU to memory or network?
Common Performance Trade-Off Patterns
- Caching and precomputation: Spend memory to save time. Works when reuse is high. Risky when key growth is unbounded.
- Streaming and iteration: Save memory, spend more CPU and time. Useful for large inputs.
- Approximate data structures: Bloom filters and sketches reduce memory for use cases like membership and cardinality, with bounded error.
- Data structure choice: Arrays favor locality. Linked lists hurt locality. Trees and tries support ordered access but add indirection.
Measure p50, p95, and p99 latency, memory high-water marks, GC pause time, and cache hit rate. Model the real cost before the design hardens.
2. Caching in Distributed Systems: Why It Works and Why It Fails
Caching keeps expensive data closer to where it is used. Memory is faster than disk. A nearby service is faster than a remote dependency. Done well, caching reduces latency, lowers database load, and smooths read performance.
But caching also changes failure modes. A stale value can quietly break business rules. A large eviction can trigger a thundering herd. A hot key can overload one node. A weak invalidation strategy can leave incorrect data in the system for hours.
Why This Matters for the Business
Every origin call costs time and money. On read-heavy workloads, caching can reduce both dramatically. It can also shield downstream systems during slowdowns.
But a cache does not remove risk. It moves it. It can hide origin weakness until expiry or eviction sends all traffic back to the database. It can also break correctness. “Never oversell inventory” is meaningless if the cache still shows stale stock.
So the real question is not whether to cache. It is what to cache, for how long, and how to preserve correctness under load.
Core Caching Patterns and Strategies
- Cache-aside: Read from cache first. On a miss, fetch from origin and populate cache. Simple and common, but it creates a stale window after writes.
- Write-through: Write to cache and database together. Better freshness, but slower writes.
- Write-back: Write to cache first and persist later. High throughput, higher risk.
Key controls:
- TTL/expiry based on data volatility
- Explicit invalidation through CDC or outbox events
- Versioned keys to survive deploys and schema changes
- Stampede protection with per-key locks or request coalescing
- Soft TTL and background refresh
- Hot-key detection and replication
- Hard size limits and eviction policies
Fix Real Production Failure
The long-term fix was better design: split volatile fields into shorter-lived keys, add invalidation through outbox and CDC, protect against stampedes, and pre-warm hot keys before peak traffic. The problem was not the caching itself. It was an incomplete cache design.
3. Latency vs Throughput vs Bandwidth in Scalable System Design
Latency, throughput, and bandwidth are related, but they are not interchangeable.
Latency is the time for one operation. Throughput is how many operations are completed in a unit of time. Bandwidth is how much data the network can carry. Teams often improve one and assume the whole system is better. That is a mistake. In distributed systems, tuning one dimension often shifts the bottleneck to another.
Batching, for example, can improve throughput, but if batches wait too long to fill, latency gets worse. A high-bandwidth link can still deliver poor effective throughput if RTT is high and there is not enough data in flight. A service can process many requests per second, while users still see delays because the queues are growing.
Why This Matters for the Business
Latency shapes user experience. Throughput defines capacity. Bandwidth affects both the movement of data and cost. SLAs are measured in milliseconds, bills arrive in gigabytes, and scale is discussed in RPS. If you optimize throughput alone, p99 may suffer. If you assume raw bandwidth solves a cross-region problem, RTT may still dominate.
Key question: Is the bottleneck in service time, network capacity, or the concurrency model?
How Latency, Throughput, and Bandwidth Interact
- Latency: Queue time + service time + network round-trip
- Throughput: Increases with concurrency until another bottleneck appears
- Bandwidth: Caps data movement, not request completion time
- Bandwidth-delay product: High-latency links need enough data in flight to be used efficiently
- Utilisation and queueing: As utilization nears 100%, queueing delay rises sharply
- Backpressure: If producers outrun consumers, queues grow and tail latency worsens
4. Tail Latency in Distributed Systems: Why Percentiles Matter More Than Averages
Average latency is comforting and often misleading. Users do not experience averages. They experience individual requests. In distributed systems, the pain is usually in the outliers: p95, p99, and p99.9.
Tail latency is not rare. At scale, it is guaranteed. And in fan-out systems, one slow dependency can dominate the whole user experience.
Why This Matters for the Business
Modern systems are called graphs. A request might pass through an API gateway, BFF, internal services, caches, databases, and third-party APIs. Each component may look healthy alone, but the slowest hop often defines the full request.
At high volume, even a 1% slow path affects many users every day. That means abandoned carts, support tickets, payment failures, and lost trust. A team can meet average latency targets and still fail customers badly.
Common Causes of Tail Latency at Scale
- Queue buildup during bursts
- Lock contention and hot rows or hot keys
- GC pauses, cold caches, and JIT warm-up
- Noisy neighbors on shared infrastructure
- Retry and backoff storms
Fan-out amplification makes this worse. If one API calls 10 services in parallel, the slowest call often determines the response time.
Design Practices for Tail Latency and Percentile-Based SLOs
- Track p95, p99, and sometimes p99.9
- Define SLOs on percentiles, not averages
- Use histograms, not just mean or median
- Load-test for burst conditions and degraded dependencies
- Use hedged requests only where duplicate work is acceptable
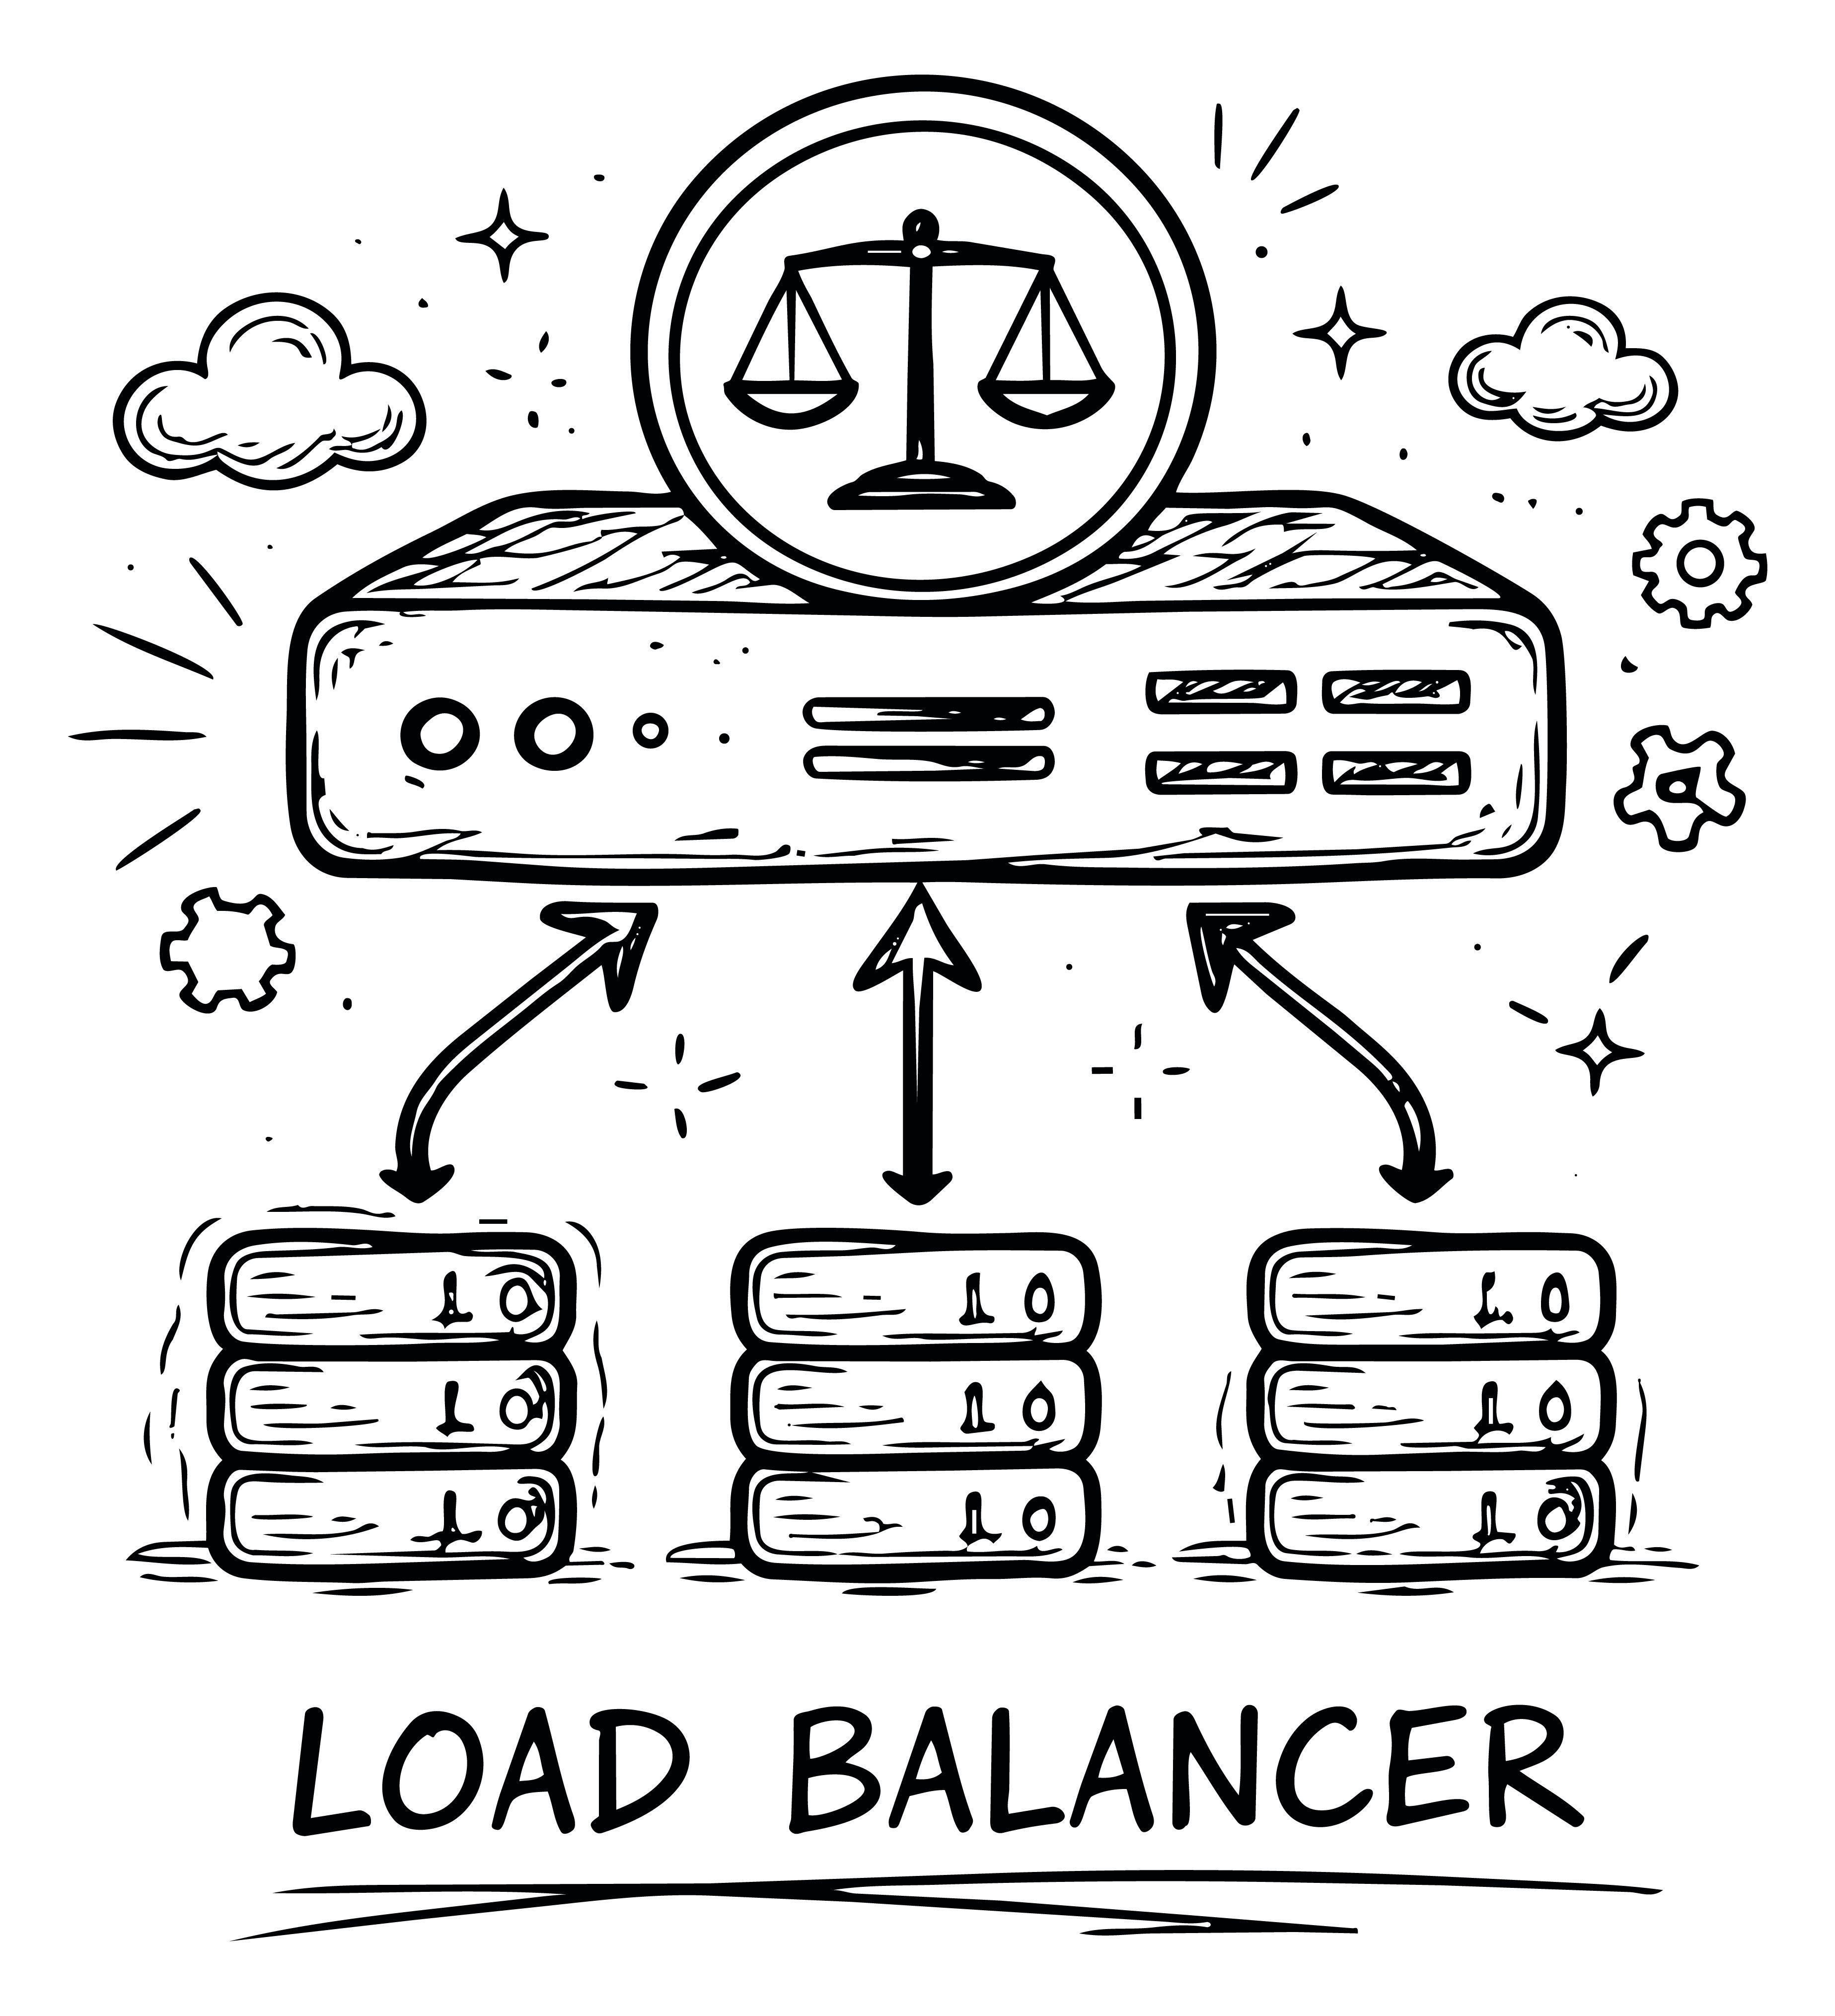
5. Load Balancing Strategies for Distributed Systems: Round Robin vs Consistent Hashing
Load balancing decides how traffic is distributed, and that shapes behavior during deploys, failures, and scaling events.
Many teams treat it as a basic infrastructure setting. It is more than that. A balancing strategy reflects assumptions about request shape, backend behavior, and state. If those assumptions are wrong, the system often becomes inefficient before it becomes obviously broken.
Why This Matters for the Business
Poor load balancing causes hot partitions, uneven CPU use, cache misses, retry storms, and dropped sessions. These effects are gradual, which is why teams often blame application code before they examine traffic distribution.
A strategy that works for stateless APIs may fail badly for caches, stream processors, and sharded data stores.
Load Balancing Strategies Explained From First Principles
- Round Robin: Good for stateless workloads with similar nodes
- Weighted Round Robin: Better when nodes have different capacities
- Least Connections: Useful when request cost varies
- IP Hashing: Provides affinity, but NAT and proxies can distort distribution
- Consistent Hashing: Preserves locality by minimizing key movement when nodes change
The core idea of Consistent Hashing is simple: when the system topology changes, move as little state as possible.
Performance and Scaling Architecture: A Practical Framework for Engineering Leaders
Performance is not something you add at the end. It is a set of trade-offs you manage from the start.
- Time vs space defines the resource budget
- Caching spends memory to save time, but only works with strong invalidation
- Latency, throughput, and bandwidth define capacity from different angles
- Tail latency shows what users actually experience
- Load balancing determines how traffic, state, and topology changes interact
When teams apply these ideas together, performance work becomes less reactive. Trade-offs get clearer, design decisions become easier to justify, and failure modes are identified earlier.
Top Performance and Scaling Architecture Questions Engineers Ask
1. When should I cache? Cache when reads greatly outnumber writes, some staleness is acceptable, and origin cost matters. Avoid it when data changes too quickly or correctness needs strict freshness.
2. Where should I measure latency? Measure at the user-facing boundary. Internal services can all look healthy while the end-to-end journey still fails.
3. Should I scale vertically or horizontally? Scale vertically when the bottleneck is tightly shared or hard to distribute. Scale horizontally when the workload is stateless or partitionable. First, identify whether CPU, memory, I/O, or network is the real limit.
4. How do I batch without hurting latency? Set a clear batch size and a maximum linger timeout. Test both under a realistic peak load. If throughput improves but p99 worsens, the batch is too large or too slow to fill.
5. What should I check first when a service is slow? Determine whether the problem is service time, queueing delay, or network delay. Use tracing, queue depth, cache hit rate, utilization, and GC data before tuning code.


How AI Improves Decision Quality in Banking, Financial Services, and Insurance